Between January and October 2025, 2,431 F&B outlets closed in Singapore. 63% had operated for five years or less — and 82% of those never recorded a profit.¹
Behind many of these closures is a number the operator never measured: their customer retention rate. One brand we work with discovered — only after unifying their data — that over 80% of their customers had visited exactly once. Until that moment, the problem was invisible.
You can’t fix what you don’t measure. Here’s how to measure it, in about 30 minutes.
The Customer Retention Rate Formula
Customer retention rate (CRR) is the percentage of existing customers who come back within a given period.
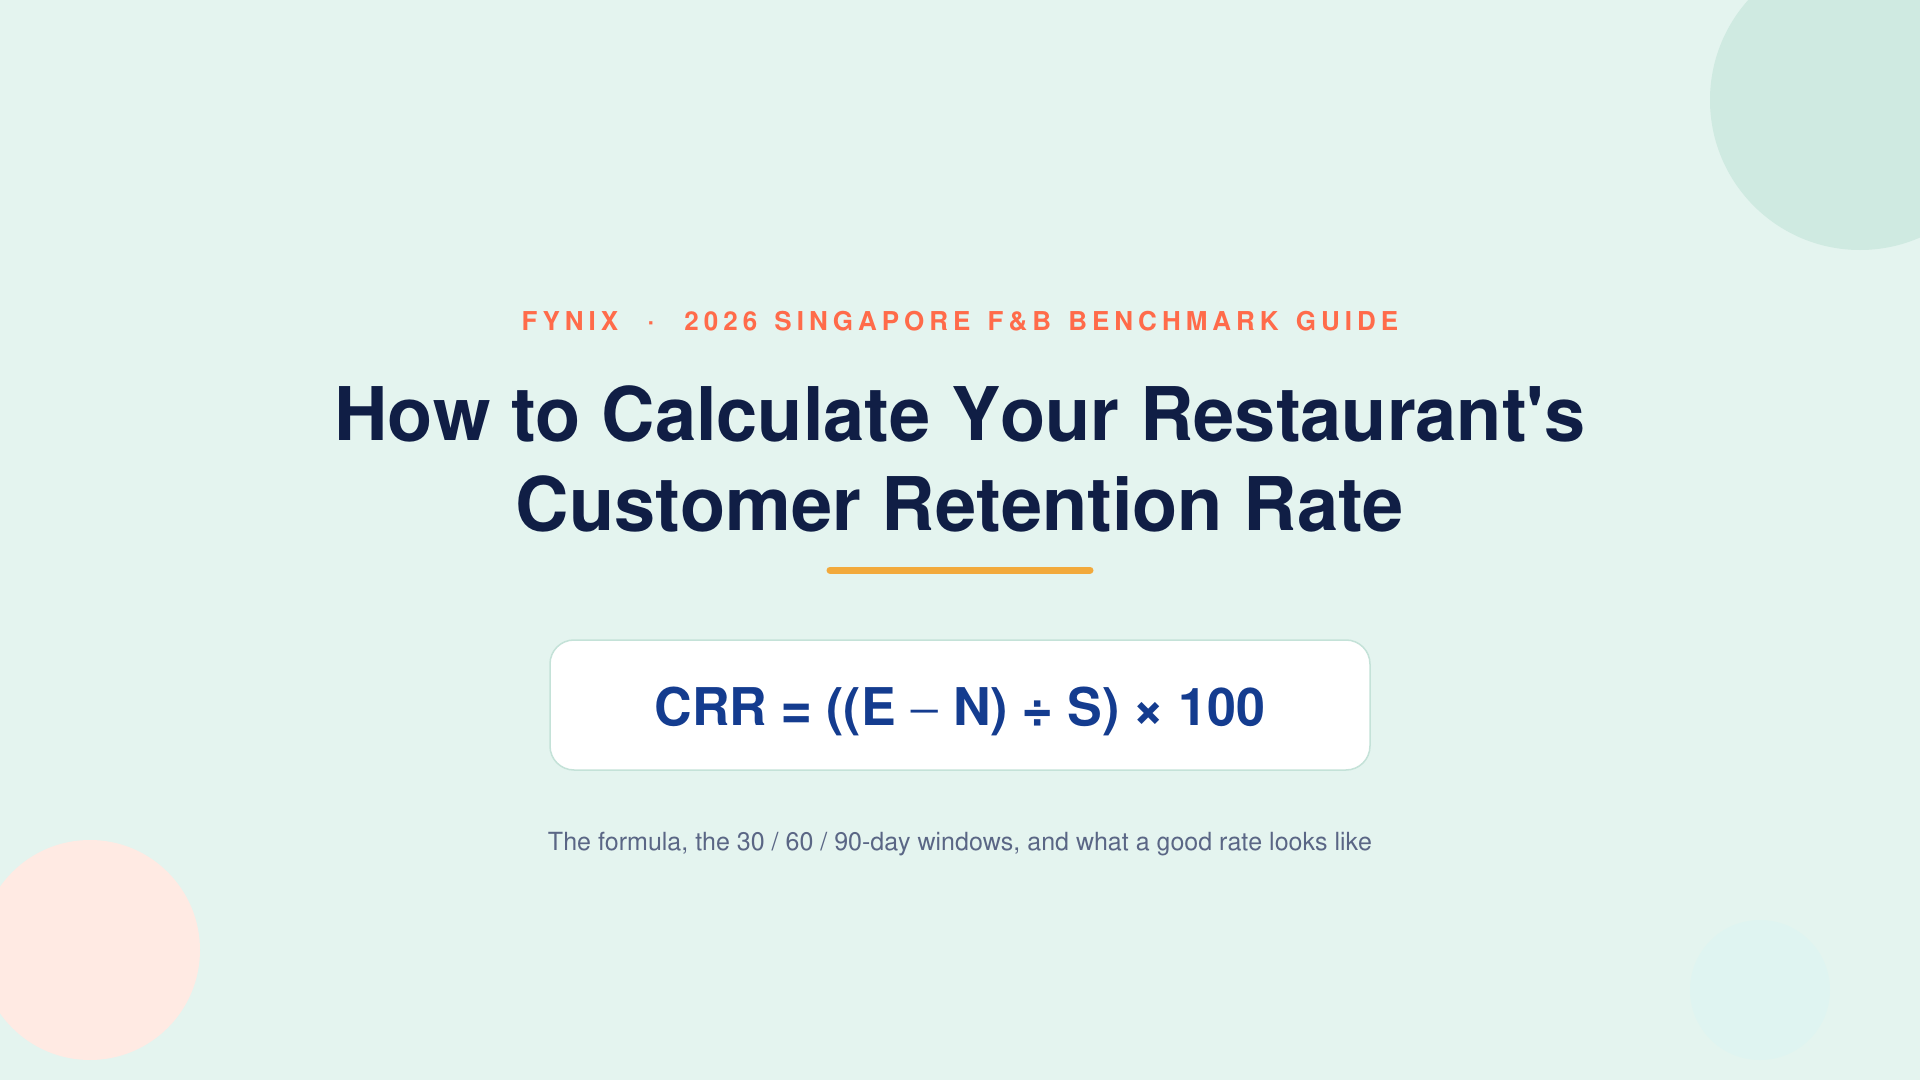
CRR = ((E − N) ÷ S) × 100
Where:
• S = customers at the start of the period
• E = customers at the end of the period
• N = new customers acquired during the period
A worked example. Say your bubble tea outlet had 600 identifiable customers at the start of the quarter. By the end, you have 700 — but 250 of those are first-timers. Your retention rate is ((700 − 250) ÷ 600) × 100 = 75%. In other words, 1 in 4 of your existing customers didn’t come back.
The formula is the easy part. The two decisions that actually determine whether the number means anything are the time window and the data source.
Pick the Right Time Window: 30, 60, and 90 Days
For F&B, we recommend calculating retention at three windows — 30, 60, and 90 days — because visit frequency varies wildly by format. A coffee customer might visit weekly; a celebration-dinner restaurant might see the same guest three times a year.
• 30-day retention suits high-frequency formats: bubble tea, coffee, hawker-adjacent QSR
• 60-day retention suits casual dining and delivery-led brands
• 90-day retention suits full-service and occasion-driven restaurants
Track the same windows every month. The trend matters more than any single reading: a 30-day retention rate that slides for three consecutive months is an early-warning signal that shows up long before revenue does.
What’s a “Good” Retention Rate for Singapore F&B?
Honest answer: published benchmarks vary widely, and most weren’t built on Singapore data. Figures anywhere from 50% to 80% get cited for restaurants globally, but the definition of “customer” and the time window differ from study to study — comparing your number against them is rarely meaningful.
A more useful set of reference points, from what we see across Singapore F&B brands:
• If more than half of your customers are one-time visitors, retention is your biggest revenue leak — and you’re in the majority, not the minority
• According to Fynix client data in The Singapore F&B Loyalty Report 2026, operators running structured loyalty programmes see repeat purchases make up as much as 34% of member transactions, with average spend per visit growing 20–25%²
• The economics compound fast: acquiring a new customer costs 3–5× more than retaining one³, and a 5% improvement in retention can lift profits by 25–95%⁴
The practical benchmark is your own baseline. Measure it this week, then measure the trend.
Where the Data Lives (and the Delivery-Platform Blind Spot)
To run the formula you need to identify repeat customers, which means every transaction needs to connect to a customer identity. Audit your touchpoints:
• POS — usually captures transactions, rarely identities
• Online ordering / QR ordering — captures identities if it’s your own channel
• Loyalty programme — your richest source, but only covers members
• Delivery platforms — here’s the trap: orders through third-party platforms belong to the platform, not you. You pay a 25–30% commission per order and receive no customer identity in return, so those diners are invisible to any retention calculation
If your systems are fragmented across these four, start by measuring retention among loyalty members only — it’s the cleanest cohort — and treat unifying your customer data as the next step. Our F&B Customer Retention: The 2026 Playbook for Singapore Operators covers that process in detail.
You’ve Measured It. Now What?
Three moves, in order:
1. Set the baseline. Record 30/60/90-day retention and your first-time vs. repeat customer split.
2. Close the identity gap. Shift orders toward owned channels (app, QR ordering) so more transactions carry a customer identity.
3. Act on the signal. This is where AI-powered CRM earns its keep: flagging customers whose visit frequency is declining 14–30 days before they lapse, and triggering re-engagement automatically — prevention instead of recovery.
FAQ
What is a good customer retention rate for restaurants? There’s no universal number — published figures range from 50% to 80% depending on format and time window. A more actionable test: if over half your customers visit only once, retention is your priority. Track your own 30/60/90-day baseline monthly and manage the trend.
How often should I calculate retention rate? Monthly, using consistent 30/60/90-day windows. Quarterly is too slow to catch a slide; daily is noise.
Can I calculate retention if most of my orders come through GrabFood or foodpanda? Not for those orders — delivery platforms keep the customer identity. Calculate retention on your owned channels and loyalty members first, and treat the platform-order share of your revenue as a measurement blind spot (and a margin one: commissions run 25–30% per order).
Does improving retention actually show up in profit? Yes, disproportionately. Retained customers cost nothing to reacquire and spend more over time: a 5% retention gain has been shown to lift profits 25–95%.⁴ According to Fynix’s 2026 Singapore F&B Loyalty Report, Singapore operators running unified loyalty programmes have cut marketing costs by up to 17% while growing spend per visit 20–25%.²
Want the full picture? The Singapore F&B Loyalty Report 2026 includes the complete retention framework, three brand case studies, and a 30-day pilot plan. Download it free →
Sources
1. Ministry of Trade and Industry, Written Reply to Parliamentary Questions on Retail Food Establishment Openings and Closures, November 2025; ACRA registration data.
2. Fynix client data; see case studies in The Singapore F&B Loyalty Report 2026.
3. Directional estimate widely cited in Invesp and Harvard Business Review research on customer acquisition economics.
4. Bain & Company / Frederick Reichheld, Harvard Business Review.